
A referral volume report is the structured operational record your admissions team uses to measure how many patient referrals arrive, where they originate, and how many convert to actual admissions. Its primary purpose is to align referral inflow with clinical capacity, accelerate bed occupancy, and give admissions directors a clear picture of which referral channels are worth investing in. Most facilities run this report on a weekly pulse cadence and a monthly deep review, with admissions directors, referral coordinators, and analysts each drawing different conclusions from the same data.
Why it matters at a glance:
- Tracks referral counts, conversion rates, and time-to-decision in one view
- Identifies high-quality referrers versus high-volume but low-converting sources
- Supports bed occupancy decisions with data rather than intuition
- Flags documentation gaps before they delay admissions
Understanding referral volume is not just about counting incoming referrals. Referral quality determines whether those referrals reduce administrative burden or add to it.
Table of Contents
- What is a referral volume report, and which metrics must it include?
- Which referral metrics are leading indicators and which are lagging?
- Where does referral volume data come from?
- How do you find high-quality, low-volume referrers?
- What should your referral volume dashboard look like?
- What should admissions teams do after running the report?
- What are the most common referral reporting mistakes?
- How does automation improve referral volume reporting accuracy?
- What benchmark ranges apply to skilled nursing and post-acute care?
- How do you implement a referral volume report in 30–90 days?
- Key Takeaways
- Why referral volume reports are only half the answer
- Smartadmissions puts your referral data to work faster
- Useful sources and next reading
What is a referral volume report, and which metrics must it include?
A complete referral volume report contains seven core metrics. Each one answers a specific operational question.

| Metric | Formula / Definition | What a bad signal looks like |
|---|---|---|
| Referral count | Total referrals received in period | Sudden drop or spike without explanation |
| Conversion-to-admission rate | Admissions ÷ Referrals | Considered low when consistently below typical facility benchmarks |
| Time-to-decision | Hours from referral receipt to accept/decline | Above 1 day consistently |
| Revenue per referral | Net revenue from admitted referrals ÷ Total referrals | Declining despite stable volume |
| Share rate / active referrers | Unique referring sources in period | Fewer than 3 active sources |
| Referral CAC | Total acquisition cost ÷ Admitted referrals | Rising faster than revenue per referral |
| Show-up rate | Patients who arrive ÷ Accepted referrals | Rates significantly under typical expectations can signal operational issues |
Analysts recommend tracking conversion, LTV, and cohort comparisons rather than raw referral counts, because raw counts hide whether your facility is actually filling beds or just processing paperwork.
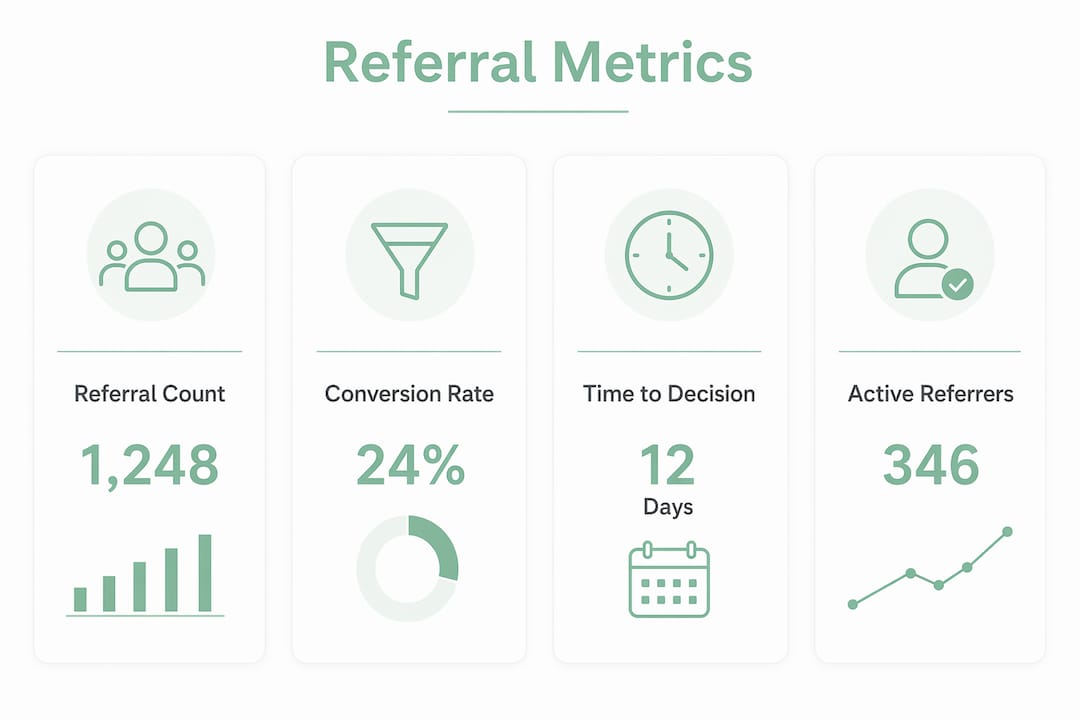
Pro Tip: Always report both the numerator and denominator. “12 admissions” tells you nothing without knowing it came from 80 referrals. Referrals per 1,000 discharges from a partner hospital is a far more comparable benchmark.
Which referral metrics are leading indicators and which are lagging?
Leading and lagging indicators serve different functions in your reporting cadence. Confusing them leads to either overreacting to noise or missing a real trend until it is too late.
| Indicator Type | Metrics | Review Cadence |
|---|---|---|
| Leading | Share rate, active referrer count, referral submissions | Weekly |
| Lagging | Conversion-to-admission, revenue per referral, referral CAC | Monthly or quarterly |
A rising share rate this week is a signal to prepare capacity. A lagging revenue uptick three weeks later confirms the quality held. Watch both, but never let a strong share rate substitute for conversion data.
Pro Tip: Set a weekly threshold alert: if active referrers drop by more than 20% week-over-week, escalate to the admissions director before the monthly review catches it too late.
Where does referral volume data come from?
Reliable referral data analysis requires pulling from multiple sources and applying attribution hygiene before any calculation.
Primary data sources:
- EMR referral and consult logs (timestamps, referring provider, clinical notes)
- Referral portals (fax-to-digital, direct portal submissions)
- CRM or marketing intake records
- Payer verification logs (eligibility check timestamps)
- Phone intake logs and manual intake forms
Attribution hygiene rules:
- Assign a unique
referrer_idto every referring entity at first contact - Tag each funnel event: referral received, screened, scheduled, admitted
- Apply a consistent 30-day attribution window for conversion credit
- Deduplicate by matching patient name, date of birth, and referring provider before aggregating
Best-practice tracking includes consistent attribution tags and event instrumentation for every funnel stage. Without them, your conversion rate is an estimate, not a fact.
Pro Tip: Monthly, pull a 5% random sample of referral records and cross-check them against your EMR admission logs and eligibility verification timestamps. Discrepancies above 3% signal a data pipeline problem worth fixing before the next report cycle.
For a deeper look at improving attribution accuracy, referral tracking enhancement guidance covers field mapping and sync cadence in detail.
How do you find high-quality, low-volume referrers?
Behavioral segmentation reveals “hidden gems” that aggregate totals obscure. A hospital that sends 8 referrals per month with a 60% conversion rate is more valuable than one sending 40 referrals at 12%.
Segmentation dimensions to apply:
- Referring entity type (hospital discharge planner, physician office, ACO)
- Payer type (Medicare, Medicaid, commercial)
- Referral completeness (clinical documents attached at submission)
- Clinical acuity level
- Geography and transport time
- Time-of-day submission patterns
Step-by-step segmentation process:
- Pull all referrers active in the last 90 days.
- Score each on four dimensions: volume, conversion rate, average time-to-admit, and documentation completeness.
- Plot into a 2×2 matrix: high conversion / high volume (“stars”), high conversion / low volume (“hidden gems”), low conversion / high volume (“noise”), and low conversion / low volume (“awareness”).
- Assign outreach priority: stars get relationship maintenance, hidden gems get capacity investment, noise gets documentation coaching, awareness gets deprioritized.
- Re-score every 30 days to avoid reacting to single-month spikes.
Pro Tip: Use 30/60/90-day cohort windows rather than a single rolling period. A referrer who looks like “noise” in a 30-day window may be a “hidden gem” when you extend to 90 days and account for seasonal discharge patterns.
Reviewing referral quality criteria alongside your segmentation matrix keeps scoring consistent across coordinators.
What should your referral volume dashboard look like?
Five chart types carry most of the analytical weight in a well-built referral volume dashboard:
- Trend line: weekly referral volume over a rolling 13-week period
- Funnel chart: referral → screened → scheduled → admitted, with drop-off rates at each stage
- Time-to-decision distribution: histogram or box plot showing median and outlier review times
- Referrer performance table: sorted by conversion rate, not raw volume
- Occupancy impact line: admitted referrals plotted against bed occupancy percentage
For analyzing referral sources and tying them to occupancy outcomes, a one-page weekly template works best for coordinators, while a monthly version with cohort comparisons serves the admissions director.
One-page template structure: Top-line KPIs (referral count, conversion rate, time-to-decision) → weekly trend chart → top 5 referrers by conversion → recent 30-day cohort performance → action items with owner and due date.
Pro Tip: Keep the weekly template to a single printed page or one dashboard screen. If coordinators need to scroll or click through tabs to find the action items, they will stop using it within two weeks.
What should admissions teams do after running the report?
Three playbooks translate report findings into owned actions.
Playbook A: Prioritize high-quality referrers
- Identify top 5 referrers by conversion rate from the most recent 30-day cohort.
- Assign a referral coordinator as the named relationship owner within 5 business days.
- Set a documentation SLA: complete clinical records required within 4 hours of referral submission.
- Track response time to each referral from this group weekly.
Playbook B: Repair noisy channels
- Audit referral form fields for completeness rates by source.
- Add required fields for clinical acuity and payer information at submission.
- Remove or deprioritize directory placements that generate high volume but sub-15% conversion.
Playbook C: Fast-track verified referrals
- Pre-verify insurance eligibility within 2 hours of referral receipt for top-tier sources.
- Implement a bed hold policy for referrers with a documented 70%+ show-up rate.
- Route pre-verified referrals directly to the admissions director queue, bypassing standard triage.
Staff efficiency tactics that pair with these playbooks can cut per-referral processing time significantly.
Pro Tip: Assign each playbook a single owner. A playbook with two owners typically gets done by neither.
What are the most common referral reporting mistakes?
Pitfall 1: Optimizing for raw volume
A high-volume source with poor conversion or incomplete documentation creates more administrative load than it fills beds. Always weight conversion rate alongside count.
Pitfall 2: Duplicate records and attribution errors
Without a consistent referrer_id and deduplication rule, the same patient can appear as two referrals from two sources, inflating both volume and apparent conversion.
Pitfall 3: Ignoring time-to-decision
Time-to-first-referral and time-between-referral-and-admission reveal whether bottlenecks sit in your workflow or in referral quality. Tracking conversion alone misses this entirely.
Pitfall 4: Single-cadence reporting
Running only a monthly report means a two-week drop in active referrers goes undetected. Weekly pulse checks on leading indicators prevent this.
Spike validation checklist:
- Confirm the spike is not a duplicate ingestion event.
- Sample 10 records from the spike period and verify against EMR logs.
- Check attribution tags for a new source that may have been miscoded.
- If validated, identify the referring entity and escalate to the relationship owner.
How does automation improve referral volume reporting accuracy?
Manual data entry introduces errors at every funnel stage. Automated EMR integration eliminates most of them by pulling referral events directly from structured data fields rather than relying on coordinator input.
Key integration points:
- EMR referral hooks (HL7 FHIR-compliant event triggers on referral creation)
- Patient eligibility APIs for real-time payer verification
- Referral portal webhooks that push submission events to your analytics layer
- Secure document ingestion pipelines with completeness scoring
Benefits of automation:
- Fewer manual entries means fewer duplicate records
- Faster time-to-decision because eligibility data arrives before the coordinator reviews the chart
- Higher documentation completeness because the system flags missing fields at submission
- Better attribution because every event is timestamped at the source
Operational reality: Facilities that automate referral ingestion and eligibility checks typically see a measurable reduction in the time coordinators spend on data entry per referral, freeing capacity for relationship management and clinical review.
EMR integration benefits for referral workflows and automated admissions outcomes are worth reviewing before scoping your integration.
Pro Tip: Run near-real-time syncs for intake events and daily reconciliation syncs for billing and payer data. Mixing cadences in a single pipeline creates timestamp mismatches that corrupt time-to-decision calculations.
An AI medical receptionist layer can further improve intake completeness by prompting referring staff for missing documentation fields at the point of submission.
What benchmark ranges apply to skilled nursing and post-acute care?
| Metric | Typical Range | Notes |
|---|---|---|
| Conversion-to-admission rate | The typical range varies by facility and case complexity, and is generally lower for high-acuity or complex cases. | |
| Average time-to-decision | 4 hours to 1 day | Sub-4 hours for pre-verified referrals |
| Show-up rate | A standard range, often confirmed for referred patients with verified insurance, applies depending on facility but varies by population. | |
| Active referrers (monthly) | Number of active referral sources typically varies with facility size and geographic location | |
| Share rate growth | Moderate month-over-month growth is sustainable; unusually high growth can signal data quality concerns |
Benchmarks shift with payer mix and clinical acuity. A facility accepting complex wound care cases will see lower conversion rates than one focused on short-term rehabilitation, even with identical referral management practices. Cohort analysis across referrer type and payer category gives you a more accurate internal benchmark than any industry average.
How do you implement a referral volume report in 30–90 days?
Stakeholders to involve from day one:
- Admissions lead (report owner and primary user)
- Referral coordinators (data validators and playbook executors)
- IT or analytics (pipeline build and field mapping)
- Clinical lead (acuity classification input)
- Billing and payer verification (revenue and eligibility data)
30-day tasks:
- Map EMR referral fields to report metrics and assign
referrer_idlogic. - Define deduplication rules and document them in a data dictionary.
- Build the weekly one-page template with top-line KPIs.
60-day tasks:
- Automate data ingestion from EMR and referral portals.
- Run first segmentation analysis using 90-day historical data.
- Assign playbook owners and set SLA thresholds.
90-day tasks:
- Conduct first quarterly deep review with cohort comparisons.
- Validate benchmark ranges against your facility’s actual payer mix.
- Establish escalation paths for spike events and attribution anomalies.
Pro Tip: Governance matters as much as the build. Assign one named report owner who is accountable for data quality, cadence, and distributing the weekly template. Without a named owner, the report drifts into inconsistency within two months.
Key Takeaways
A referral volume report is only as useful as the metrics it tracks and the actions it triggers. Facilities that monitor both leading and lagging indicators, segment referrers by quality, and automate data ingestion consistently outperform those that track raw counts alone.
| Point | Details |
|---|---|
| Define metrics precisely | Include conversion rate, time-to-decision, and show-up rate alongside raw referral counts. |
| Monitor leading and lagging indicators | Watch share rate weekly; review revenue per referral and referral CAC monthly. |
| Segment by quality, not volume | Use a 90-day cohort to find hidden gems with high conversion and fast time-to-admit. |
| Automate ingestion for accuracy | EMR and portal integration eliminates duplicate records and improves attribution. |
| Smartadmissions accelerates this | Smartadmissions automates referral ingestion, eligibility checks, and analytics so your team acts on data, not data entry. |
Why referral volume reports are only half the answer
The facilities that get the most from referral data are not the ones with the most sophisticated dashboards. They are the ones that treat the report as a trigger for a conversation, not a final verdict. A coordinator who sees a “hidden gem” referrer in the segmentation table and picks up the phone to strengthen that relationship will outperform a team that simply re-sorts the table every month.
The other underappreciated reality: time-to-decision data is more actionable than conversion rate for most admissions teams. Conversion rate tells you what happened. Time-to-decision tells you where your process slowed down and gives you something specific to fix this week. Prioritizing that metric in your weekly review, rather than saving it for the monthly deep dive, is the single fastest way to improve bed occupancy without adding staff.
Smartadmissions puts your referral data to work faster
Faster bed occupancy starts with cleaner referral data, and Smartadmissions delivers both. The platform connects directly to your EMR and referral portals, ingests referral events automatically, and runs real-time insurance eligibility checks before your coordinator opens the chart. That means your referral volume report reflects actual admissions pipeline data, not coordinator memory.
Smartadmissions includes built-in analytics templates covering conversion rate, time-to-decision, and referrer performance, so your team spends time acting on the report rather than building it. Facilities using the platform have reduced manual intake steps and improved documentation completeness across their referral pipeline. For administrators ready to move from spreadsheet-based tracking to a purpose-built system, referral documentation best practices and automated admissions outcomes are the right starting points. Schedule a demo at smartadmissions.ai to see how the platform maps to your current workflow.
Useful sources and next reading
- Referral Tracking: A Guide to Metrics, Methods, and ROI — use for leading vs. lagging indicator definitions and cohort methodology
- Referral Source ROI Analysis Guide — use for segmentation frameworks and ROI calculation
- Referral Program Analytics: Metrics That Matter — use for attribution hygiene and funnel metric selection
- Referral Traffic: How to Read, Grow, and Clean It Up — use for quality-over-volume guidance and pitfall mitigation
- How to Enhance Referral Tracking for Higher Bed Occupancy — Smartadmissions implementation guide for attribution and tracking
- 7 Key Types of Patient Referrals Admissions Teams Must Know — use when mapping referral types to segmentation categories
- Optimize Bed Occupancy: Proven Strategies for Skilled Nursing — use to connect referral report outcomes to occupancy strategy
- Why Maintain Referral Partner Relationships: 5 Key Benefits — use when building outreach playbooks for stars and hidden gems